
The following is a guest post by Nicole Giuliani.
Food researchers (such as myself) study topics such as how often people crave their favorite foods or how well they are able to control those desires. We use a variety of laboratory measurement instruments as a proxy for how food craving and control work in the real world. However, it is not yet known how well many of those instruments—including the most common ones—predict actual food consumption out in the real world. Furthermore, we do not know how well the measurements we take in the laboratory predict real world eating for people who are on a diet versus people who are eating without restriction. Three common types of measurements are: people’s reports of how much they generally tend to desire certain foods and to regulate those desires (which we call “stable” tendencies to desire and regulate desire); people’s reports of the desirability of those foods at the moment that they view them or try to control their desire for them (“momentary”), and how people’s brain activity changes when they look at pictures of their desired foods or try to control their desire for those foods (“neural”).
My colleagues Elliot Berkman, Traci Mann, Janet Tomiyama and I recently published a study in the journal Psychosomatic Medicine in which we directly compared how well each of these three types of laboratory measurements predicted real world consumption of a favored tasty but unhealthy food. We brought a group of healthy people into the lab, asked them what their favorite unhealthy food was, and then gathered stable, momentary, and neural measurements of their craving for that food and their ability and tendency to regulate that craving. At the very end of the lab session, we split our participants into two random groups: one in which participants would simply record how much of their favorite unhealthy food they ate each day across the following two weeks (“monitor” group), and another in which participants tried not to eat their food and also recorded how much of it they ate (“restrict” group).
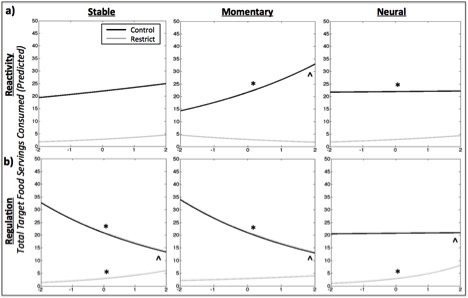
Graphs representing the relationship between Stable, Momentary, and Neural Reactivity (a) and Regulation (b) and Predicted Total Target Food Servings Consumed. Participants instructed to restrict target food consumption are shown in gray, participants instructed to simply monitor consumption (control) are shown in black. The x-axis scales represent the degree of reactivity (top row) or regulation (bottom row) in standard units, and reflect a composite of the measures based on independent components analyses as described in the text; y-axis scales are the predicted total number of target food servings consumed across the two-week sampling period. * ME p < 0.05; ^ interaction p < 0.05
This experiment revealed some interesting differences in how well the instruments predicted actual food consumption in the two groups. First, higher scores on the momentary and neural measurements of food craving predicted more food consumption only for the monitor group, and had no relationship with eating in the restriction group. In other words, people who said they craved foods when exposed to them (and whose brains reacted strongly to those foods) generally ate more, but only when they weren’t trying to diet. Second, greater scores on the stable and momentary measurements of food regulation predicted less eating in the monitor group, whereas greater scores on the stable and neural measurements of food regulation predicted more consumption for the restriction group. That is, people who say they are “good regulators” do indeed eat less—but only when they aren’t trying to. When they try to diet, they actually eat more! This set of results is important because it suggests that food researchers should chose their measurements carefully, in part based on whether or not their participants will be restricting their food intake.
Citation info: Giuliani, N.R., Tomiyama, A.J., Mann, T., & Berkman, E.T. (in press). Prediction of daily food intake as a function of measurement modality and restriction status. Psychosomatic Medicine.